


Blog
AI Observability for Enterprises: How to Monitor Models, Agents and RAG in Production

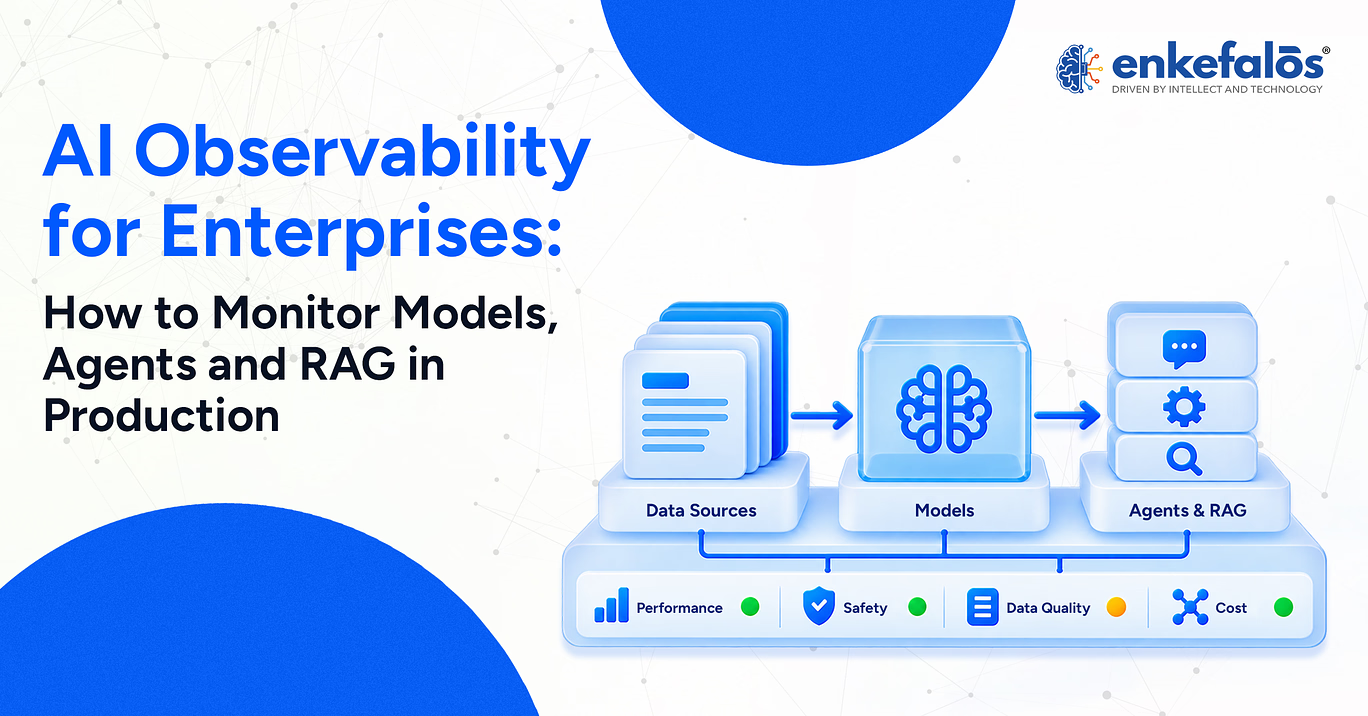
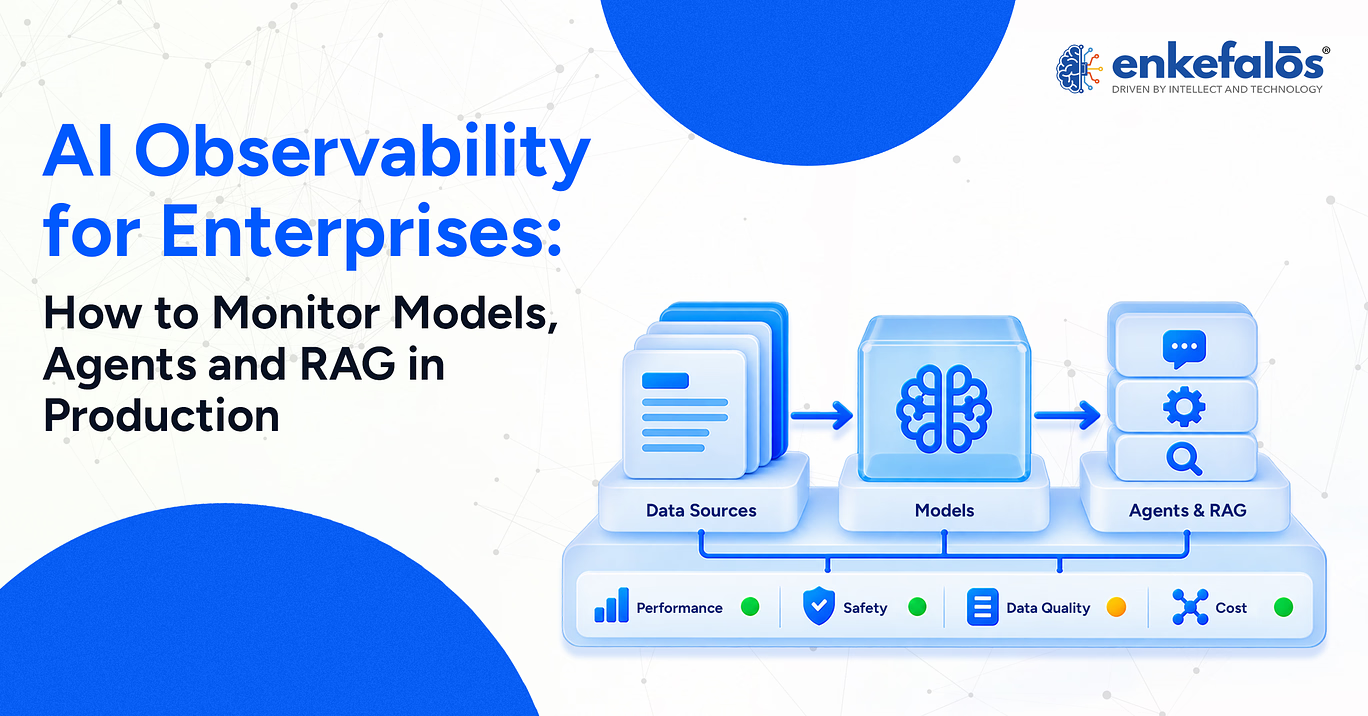
Enterprise AI systems are becoming more complex. A production application may combine large language models (LLMs), retrieval-augmented generation (RAG), AI agents, external tools, private data, APIs, and multiple deployment environments. Monitoring only infrastructure uptime is no longer enough to understand whether these systems are behaving as expected.
AI observability gives enterprises visibility into how AI systems perform after deployment. It brings together logs, traces, metrics, evaluations, model outputs, retrieval behavior, agent actions, and user feedback so teams can investigate failures, detect changes, and understand how an AI application behaves in production. NIST emphasizes that post-deployment monitoring is important because AI systems can encounter unexpected outputs and behaviors under real-world conditions that may not appear during pre-deployment testing.
What Is AI Observability?
AI observability is the ability to understand the behavior, quality, performance, and operational state of AI systems using telemetry and evaluation data collected across the AI workflow.
Traditional monitoring may answer whether a service is available or whether latency has increased. AI observability goes further by helping teams understand why an AI response, retrieval step, or agent action behaved differently.
AI observability may include:
- Model input and output monitoring
- Prompt and response traces
- Token usage
- Latency and error rates
- Model version tracking
- Evaluation scores
- RAG retrieval quality
- Agent tool calls and outcomes
- Guardrail events
- User feedback
- Cost and resource usage
OpenTelemetry’s current Generative AI semantic conventions support standardized telemetry for model operations, including model calls, token use, latency, prompts, responses, tool calls, and tool results where organizations choose to capture that content.
Why AI Observability Matters for Enterprises
AI systems are probabilistic and can behave differently from conventional software. The same application may produce different outputs depending on model version, prompt context, retrieved data, tool responses, or user input.
Observability helps enterprises identify issues such as:
- Model performance degradation
- Unexpected output behavior
- Retrieval failures
- Increased hallucination or ungrounded responses
- Agent tool-call failures
- Latency regressions
- Rising token or inference costs
- Guardrail violations
- Changes after a model or prompt update
NIST’s AI Risk Management Framework recommends monitoring AI functionality and behavior in production and comparing production performance with pre-deployment evaluation results.
For enterprises, this makes observability both an operational and a governance capability.
What Should Enterprises Monitor in AI Systems?
Enterprise AI observability should cover more than the model itself. Teams need visibility across the complete application path.
For LLMs and models, monitor:
- Response quality
- Latency
- Error rates
- Token usage
- Model versions
- Safety events
- Output consistency
- Cost per request
For AI agents, monitor:
- Agent invocations
- Task completion
- Tool selection
- Tool-call success or failure
- Tool latency
- Number of reasoning or workflow steps
- Escalations to humans
- Unexpected or unauthorized actions
Google Cloud’s current agent observability guidance specifically highlights LLM interactions, prompts, responses, token usage, latency, errors, and tool usage as important agent signals.
For RAG systems, monitoring should include both retrieval quality and generated-answer quality, since a weak response may begin with poor retrieval rather than with the language model.
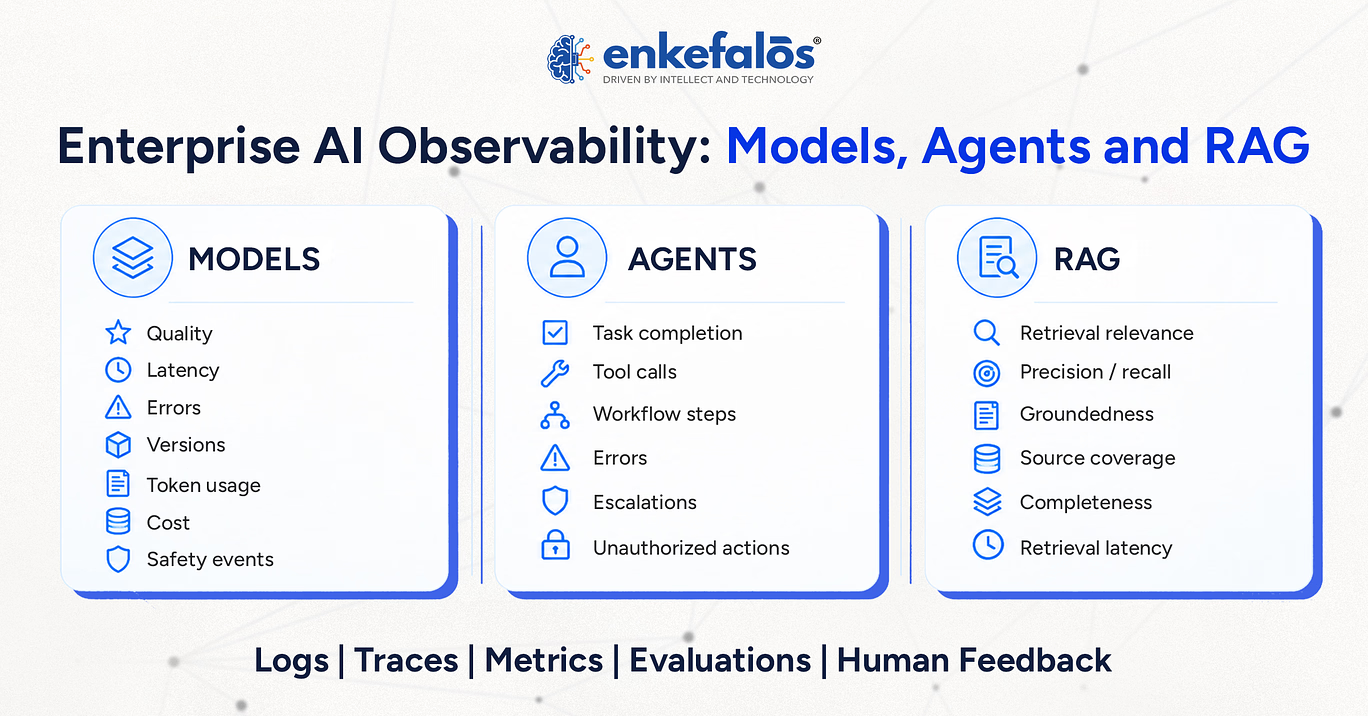
Enterprise AI observability requires visibility across model performance, agent execution, RAG retrieval and generation quality, supported by telemetry, evaluation and human feedback.
How to Monitor AI Models in Production
Model monitoring should combine operational telemetry with continuous evaluation.
Operational monitoring can track whether models are available and performing within expected infrastructure thresholds. Quality monitoring then evaluates whether responses continue to meet business and application requirements.
Enterprises can monitor:
- Request volume
- Model latency
- Error rate
- Input and output token usage
- Inference cost
- Response quality
- Safety or policy violations
- Version-to-version changes
- User feedback
- Drift from evaluation baselines
Production evaluations can also compare model outputs against test sets, domain criteria, or human review.
NIST notes that post-deployment monitoring is needed because real-world conditions may expose behavior that controlled pre-deployment tests do not capture.
Version tracking is particularly important. When a model, prompt, retrieval configuration, or guardrail changes, observability should help teams determine whether quality improved or regressed.
How to Monitor RAG Systems in Production
RAG observability requires monitoring both retrieval and generation.
A model may generate a fluent answer while using irrelevant or incomplete source material. For that reason, monitoring only the final response can hide the real cause of failure.
Key RAG signals include:
- Retrieval relevance
- Retrieval precision
- Retrieval recall
- Ranking quality
- Number of retrieved chunks
- Groundedness
- Response relevance
- Response completeness
- Retrieval latency
- End-to-end latency
- Citation or source coverage
Microsoft’s current RAG evaluation guidance separates process evaluation from system evaluation. Retrieval metrics evaluate whether the system found useful documents, while groundedness and relevance evaluate whether the generated response correctly uses the retrieved context.
This distinction is important when debugging. A poor answer may result from a weak model response, but it may also come from poor chunking, incorrect indexing, weak ranking, stale documents, or missing context.
Key AI Observability Metrics for Enterprises
The right metrics depend on the AI workload, but enterprise monitoring usually needs operational, quality, retrieval, agent, and governance signals.
| Area |
Example Metrics |
|
Model Operations |
Latency, error rate, request volume, token usage |
|
Model Quality |
Relevance, correctness, consistency, task-specific evaluation |
|
RAG Retrieval |
Precision, recall, relevance, ranking quality |
|
RAG Generation |
Groundedness, response relevance, completeness |
|
AI Agents |
Tool selection, tool-call success, task completion, step count |
|
Cost |
Tokens per request, model usage, cost per workflow |
|
Safety |
Guardrail triggers, policy violations, blocked responses |
|
Human Oversight |
Escalation rate, approval rate, reviewer feedback |
Microsoft’s current agent evaluators include tool selection, tool input accuracy, tool-output utilization, and tool-call success, illustrating how agent observability extends beyond standard model metrics.
Enterprises should define thresholds based on business requirements rather than relying on one universal benchmark.
AI Observability Architecture
An enterprise AI observability architecture typically collects telemetry across multiple layers and brings it into a common monitoring and evaluation environment.
A practical architecture can include:
- Instrumentation layer: Captures model calls, tool calls, retrieval events, prompts, outputs, errors, and timing.
- Telemetry layer: Collects traces, metrics, logs, and events using common schemas where possible.
- Evaluation layer: Measures response quality, groundedness, agent behavior, safety, and domain-specific criteria.
- Storage and analytics layer: Retains operational and evaluation data for trend analysis and investigation.
- Alerting layer: Notifies teams when thresholds, guardrails, or service-level objectives are exceeded.
- Governance layer: Links observed behavior to model versions, owners, approvals, policies, and audit evidence.
Using standardized telemetry such as Open Telemetry semantic conventions can help organizations avoid building a separate observability format for every model or framework.
AI Observability for Private and Enterprise AI
Private AI environments still require continuous observability. Keeping workloads on-premises or in private cloud does not automatically provide visibility into model behavior, retrieval quality, or agent actions.
Private AI observability can help enterprises monitor:
- Model behavior within controlled infrastructure
- Internal data retrieval
- User and agent access
- Tool execution
- Guardrail events
- Model and prompt versions
- Sensitive-data exposure
- Audit trails
- Human approvals
The main difference is where telemetry is collected, stored, and processed. Organizations may need observability data to remain within the same trust boundary as their models and enterprise data.
This is particularly relevant in regulated environments where prompts, retrieved documents, and model outputs may contain confidential or sensitive information.
Common AI Observability Challenges
Building AI observability across an enterprise introduces several practical challenges.
- Fragmented telemetry: Different models, frameworks, and cloud platforms may generate different logs and metrics.
- Data sensitivity: Prompts, responses, retrieval context, and tool outputs may contain sensitive enterprise information.
- Non-deterministic behavior: AI responses can vary, making simple pass/fail monitoring difficult.
- Evaluation complexity: Some quality dimensions require human review or model-based evaluators rather than standard infrastructure metrics.
- Multi-step agents: Failures may occur anywhere across planning, model calls, tool use, APIs, or external systems.
- Scale and cost: Detailed tracing can generate large volumes of telemetry.
- Metric overload: Collecting hundreds of metrics without defined thresholds can create dashboards without actionable insight.
NIST’s 2026 report on deployed AI monitoring similarly notes that monitoring methodologies and terminology remain fragmented, even though post-deployment visibility is increasingly important.
How Enterprises Can Build an AI Observability Strategy
An observability strategy should start with business risk and system behavior rather than with dashboards.
A practical approach is:
- Inventory AI systems. Identify models, RAG applications, agents, tools, and deployment environments.
- Define expected behavior. Document what successful performance looks like for each application.
- Select meaningful metrics. Choose operational, quality, safety, cost, and business measures.
- Instrument end-to-end workflows. Trace model calls, retrieval, tool calls, and application events.
- Establish evaluation baselines. Compare production behavior with pre-deployment tests.
- Set alerts and thresholds. Define when teams should investigate or intervene.
- Connect telemetry to versions. Track changes in models, prompts, data, and retrieval configuration.
- Includes human feedback. Capture reviewer decisions and user feedback where appropriate.
- Review continuously. Update monitoring as models, data, and business workflows change.
This approach aligns with NIST’s broader guidance that AI measurement and risk management should continue throughout the lifecycle.
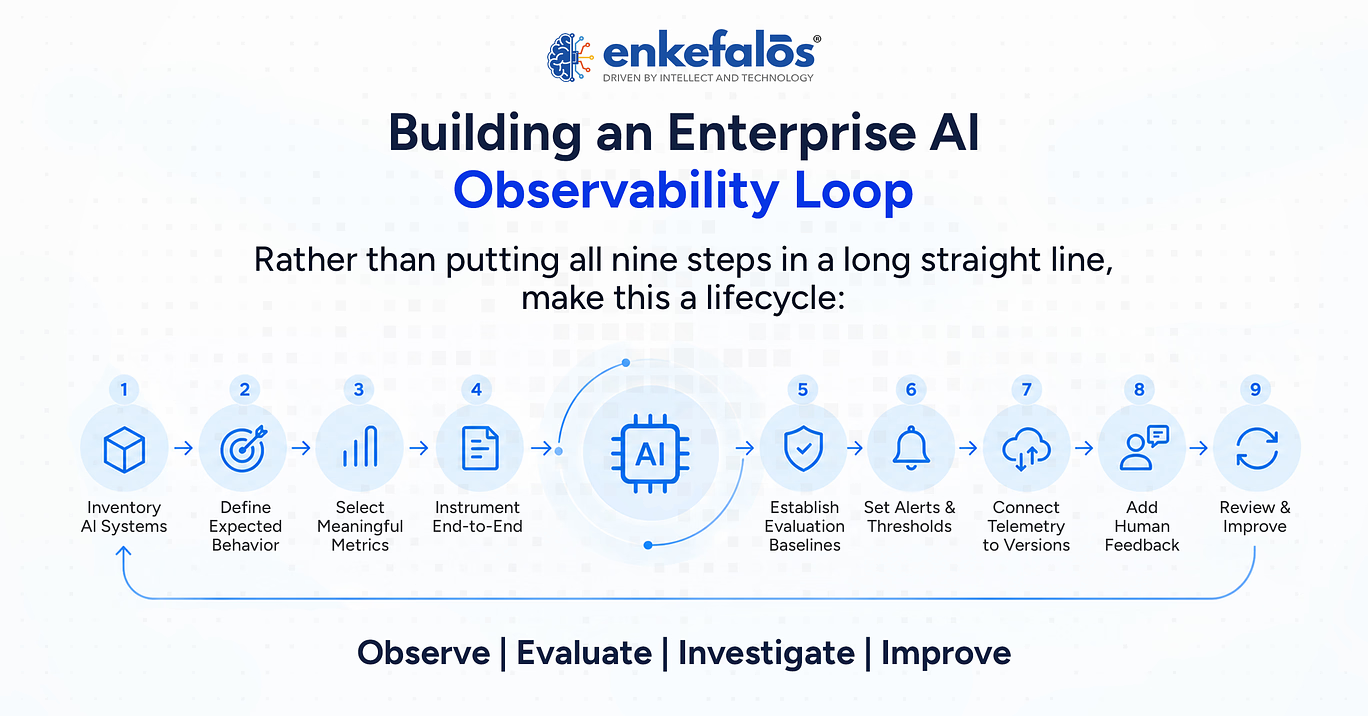
Effective AI observability is a continuous loop connecting system inventory, meaningful telemetry, evaluation baselines, alerts, version tracking, human feedback and ongoing improvement.
AI Observability vs AI Governance
AI observability and AI governance are related, but they are not the same.
An effective AI governance framework helps enterprises define responsibilities, establish policies, and maintain oversight of AI systems.
AI observability provides evidence about what an AI system is doing in production.
AI governance defines who is responsible, what policies apply, which systems are approved, what risks are acceptable, and how decisions should be controlled.
Observability supports governance by providing:
- Model and agent activity records
- Version history
- Evaluation results
- Guardrail events
- Tool-call traces
- Performance trends
- Human-review outcomes
- Audit evidence
- Governance determines what should happen. Observability helps verify what actually happened.
NIST’s AI RMF reflects this relationship by treating governance as a cross-cutting function while measurement includes ongoing monitoring and evaluation of deployed AI systems.
Can You Explain What Your AI Did in Production?
Assess whether your enterprise has the visibility to monitor model quality, RAG retrieval, agent actions, policy events, versions, and human interventions after deployment.
How Enkefalos Supports Enterprise AI Observability
Enkefalos positions GenAI Foundry as a private AI control plane for building, governing, evaluating, deploying, and monitoring enterprise AI systems. Its current platform information emphasizes continuous monitoring, evaluation, traceability, guardrails, version-controlled deployment, and auditability across on-premises, private-cloud, and hybrid-ready environments.
The platform supports observability-related capabilities across several parts of the AI lifecycle:
- Evaluation: Models can be evaluated against task-specific criteria and reviewed by subject-matter experts before and after deployment.
- Deployment control: Model versions and production releases can be tracked with rollback and environmental isolation.
- Guardrails: Policy violations, personally identifiable information exposure, misuse, and other runtime events can be detected and logged.
- RAG and knowledge: Retrieval, ranking, and context configurations can be managed within project-scoped knowledge environments.
- Auditability: Inputs, outputs, model versions, policy decisions, and operational events can be retained for review.
- Private deployment: Observability can remain aligned with enterprise data and infrastructure boundaries.
GenAI Foundry also supports continuous monitoring and improvement, including monitoring for hallucination, drift, user feedback, and operating cost while keeping model updates under controlled processes.
These capabilities can help enterprises connect observability with evaluation, governance, deployment control, and human oversight instead of treating monitoring as a separate production tool.
Observe, Govern and Improve Production AI
Connect evaluation, runtime monitoring, RAG visibility, agent activity, version control and auditability within a governed enterprise AI environment.
Conclusion
As enterprise AI moves into production, observability becomes necessary for understanding not only whether systems are running, but how they are behaving. Models can change in quality, RAG pipelines can retrieve weak or outdated context, and agents can fail at different points across planning, tool use, and execution. Enterprises need visibility across these interactions to identify where problems originate and how they affect business workflows.
A strong AI observability approach brings together telemetry, evaluations, traces, retrieval signals, agent activity, version history, guardrail events, and human feedback. This gives teams the evidence needed to investigate failures, compare changes between releases, support governance, and improve AI systems over time.
As enterprise AI becomes more autonomous and interconnected, observability will increasingly serve as the operational foundation for running models, agents, and RAG systems with greater transparency, control, and accountability.
Frequently Asked Questions
1. What is AI observability?
AI observability is the ability to understand the behavior, performance, quality, and operational state of AI systems using logs, traces, metrics, evaluations, outputs, and other telemetry.
2. Why is AI observability important for enterprises?
It helps enterprises detect failures, performance changes, retrieval problems, agent errors, cost increases, and policy violations after AI systems move into production.
3. What should enterprises monitor in an LLM?
Enterprises can monitor latency, error rates, token usage, response quality, model versions, safety events, user feedback, and task-specific evaluation metrics.
4. How do you monitor AI agents?
Agent monitoring can track prompts, model calls, tool selection, tool-call success, execution steps, latency, errors, task completion, escalations, and unexpected actions.
5. How do you monitor RAG applications?
Monitor retrieval quality and final-response quality separately. Useful signals include retrieval relevance, precision, recall, ranking quality, groundedness, completeness, response relevance, and latency.
6. What is RAG observability?
RAG observability provides visibility into how a RAG system retrieves information, constructs context, generates responses, and uses grounding sources in production.
7. What metrics should be monitored for AI agents?
Useful agent metrics include task-completion rate, tool selection, tool-call success, tool latency, model latency, token use, execution steps, errors, escalations, and policy events.
8. What is the difference between AI monitoring and AI observability?
Monitoring tracks predefined metrics and conditions. Observability combines multiple signals to help teams understand why an AI system behaved in a particular way.
9. How does AI observability support AI governance?
Observability provides evidence about model behavior, agent actions, policy events, versions, and human review, which governance teams can use for oversight and audit processes.
10. How can enterprises monitor private AI systems?
Enterprises can instrument private AI workloads with internal logs, traces, metrics, evaluations, and audit records while keeping observability data within approved on-premises, private-cloud, or hybrid environments.